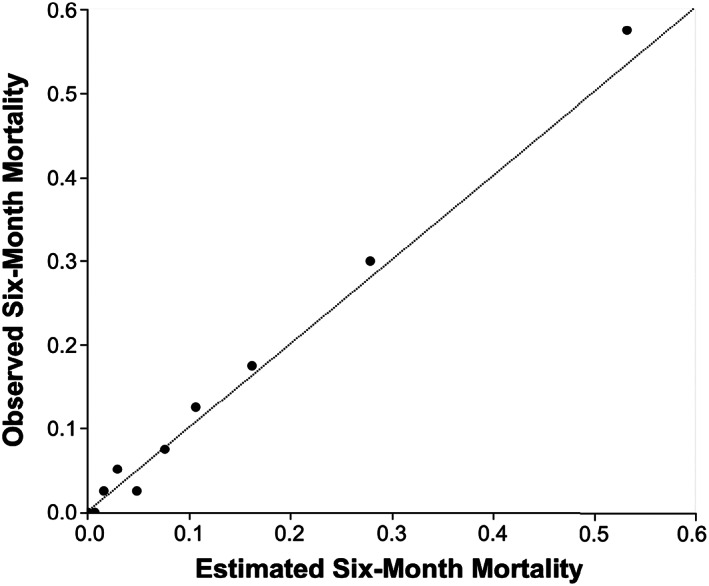
Figure 6.

Calibration plot of observed to estimated 6‐month mortality following adult living‐donor liver transplantation. Calibration plot of the prognostic index on postoperative day 14 (PI POD‐14), in the overall dataset (n = 400). The whole cohort was divided into 10 groups by percentile, and model‐predicted versus actual 6‐month mortalities were plotted according to each subgroup. PI POD‐14 was well calibrated, and the diagonal line represents a perfect calibration.
