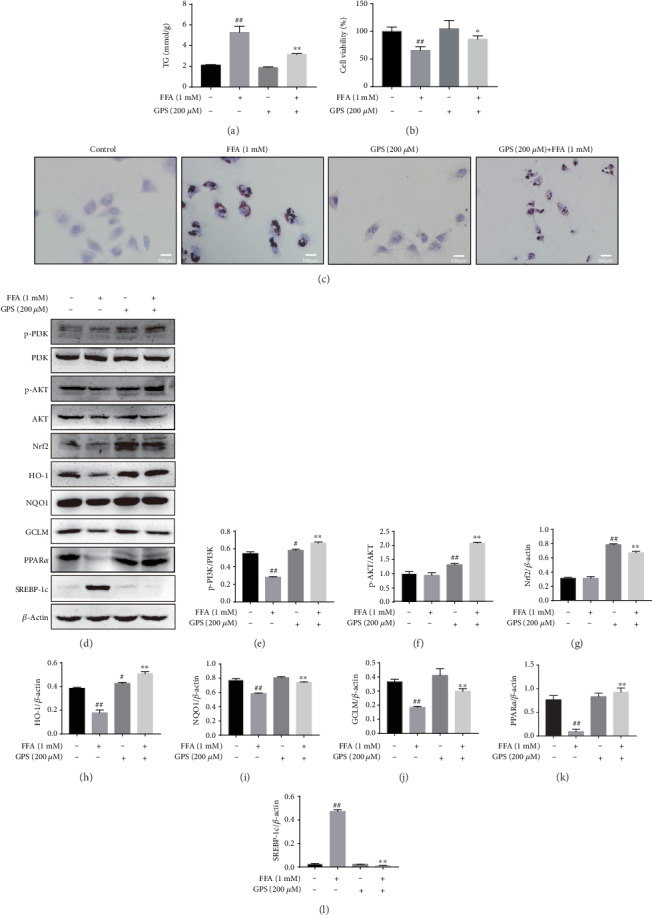
Figure 3.

Effects of GPS on FFA-stimulated lipogenesis, cytotoxicity, and oxidative stress in HepG2 cells. These cells were cultured with 200 μM GPS for 1 h and then treated with 1 mM FFA for 24 h. (a) Lipid accumulation was measured using the TG detection kit. (b) CCK-8 assay cell viability. (c) Representative photos of Oil Red O staining. (d) The levels of PI3K/AKT, Nrf2, HO-1, NQO1, GCLM, PPARα, and SREBP-1c were evaluated by Western blotting assays. (e–l) The expression of p-AKT was normalized to AKT; of p-PI3K was standardized to PI3K; and of Nrf2, HO-1, NQO1, GCLM, PPARα, and SREBP-1c was standardized to β-actin, respectively. All data are presented as mean ± SD (three independent experiments). #p < 0.05 and ##p < 0.01 vs. control group; ∗p < 0.05 and ∗∗p < 0.01 vs. FFA-treated group.
