


. 2020 Jun 17;2020:6137450. doi: 10.1155/2020/6137450
Copyright © 2020 Lu Wang et al.
This is an open access article distributed under the Creative Commons Attribution License, which permits unrestricted use, distribution, and reproduction in any medium, provided the original work is properly cited.
Figure 16.
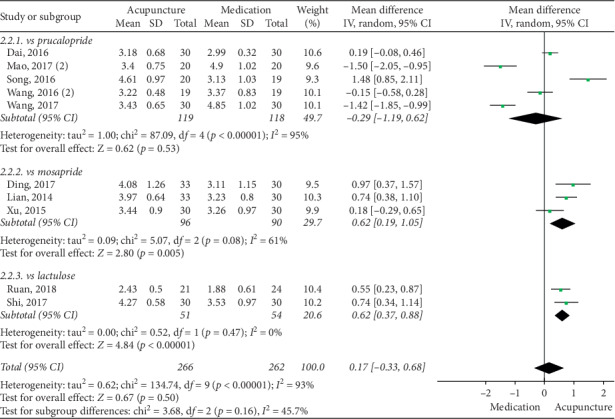
Forest plot for BSFS by subgroup analysis.