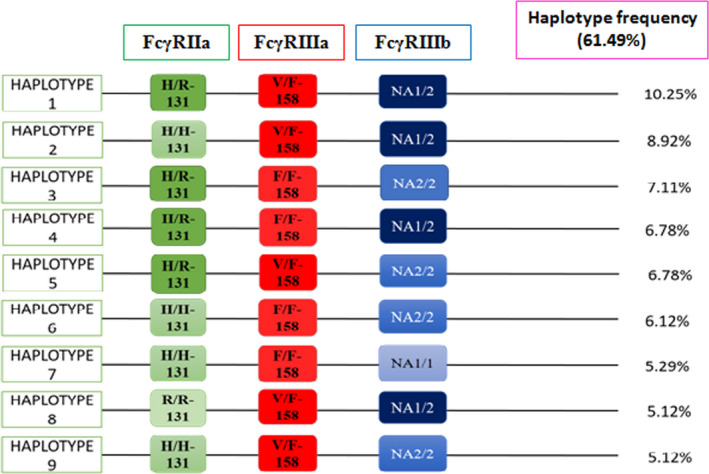
Figure 2.

Haplotype frequencies for FcγRIIa, FcγRIIIa, and FcγRIIIb (FcγRs) polymorphisms for the study subjects from Bangladesh. The nine most predominant patterns (haplotypes 1–9; frequency >5%) represented 61.49% of total variation and were selected for haplotype analysis. The frequencies of specific haplotypes are presented on the left.
