
Figure 7.
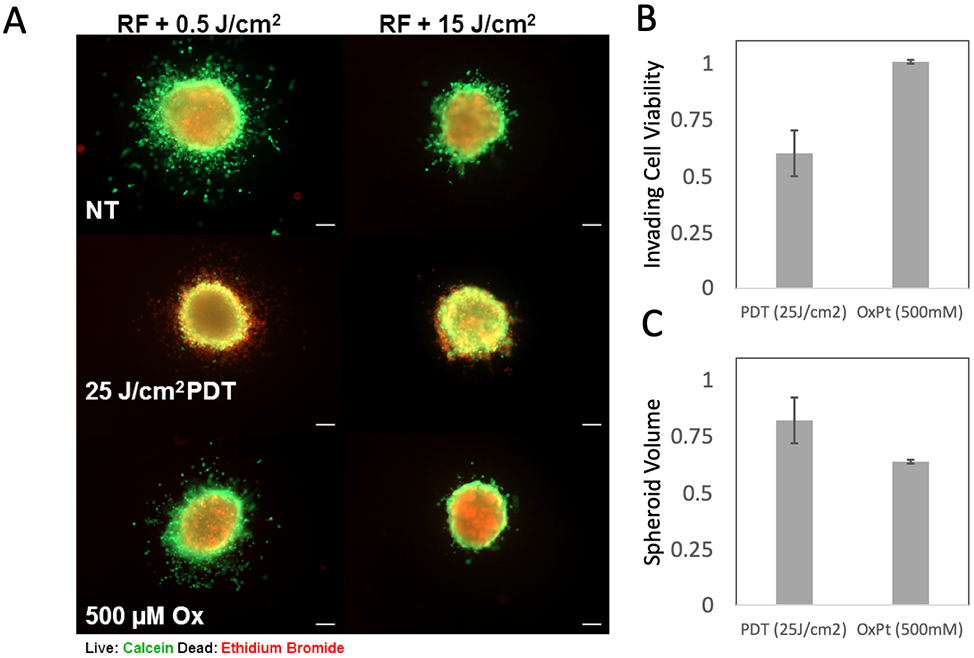
Response to verteporfin PDT and oxaliplatin (Ox) chemotherapy in COL1 environments with high and low photocrosslinking. Fluorescence images in A) show representative transplanted spheroids receiving no treatment (NT), verteporfin activated by 690nm light at 25J/cm2 or 500μM oxaliplatin, in COL1 with RF exposed to 0.5 J/cm2 (left panels) or 15 J/cm2 (right panels). Panel B) shows quantitative assessment of invading cell fields (from COL1 with low crosslinking). Treatment response of invading cells (reported as number of viable invading cells divided by total, relative to NT control) shows significant chemoresistance, yet sensitivity to PDT in this populations (p = 0.016, two-tailed student’s t-test). This analysis is based on image-segmentation which excludes the primary spheroid and quantifies live and dead invading cells only. Panel C) shows residual viable tumor volume for PDT and chemotherapy treated primary spheroids (in high-crosslinking invasion-suppressing COL1 conditions). Here, greater growth inhibition of primary spheroids is achieved with oxaliplatin chemotherapy relative to verteporfin PDT.