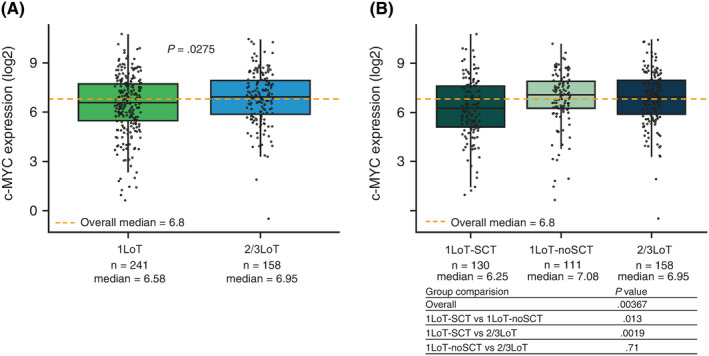
FIGURE 1.

c‐MYC expression by prior treatment exposure. A, Median c‐MYC expression was significantly lower in 1LoT vs 2/3LoT patients. B, Median c‐MYC expression was significantly lower in 1LoT‐SCT vs 1LoT‐noSCT or 2/3LoT patients. No significant difference was observed between 1LoT‐noSCT and 2/3LoT patients. Overall P‐values are analysis of variance F‐test P‐values, and pairwise comparison P‐value are two sample t test P‐values). Solid black horizontal lines show the medians, dotted orange lines show the overall medians, boxes show interquartile range, lines show range excluding outliers. LoT, line of therapy; SCT, stem cell transplantation [Colour figure can be viewed at wileyonlinelibrary.com]
