
FIGURE 3.
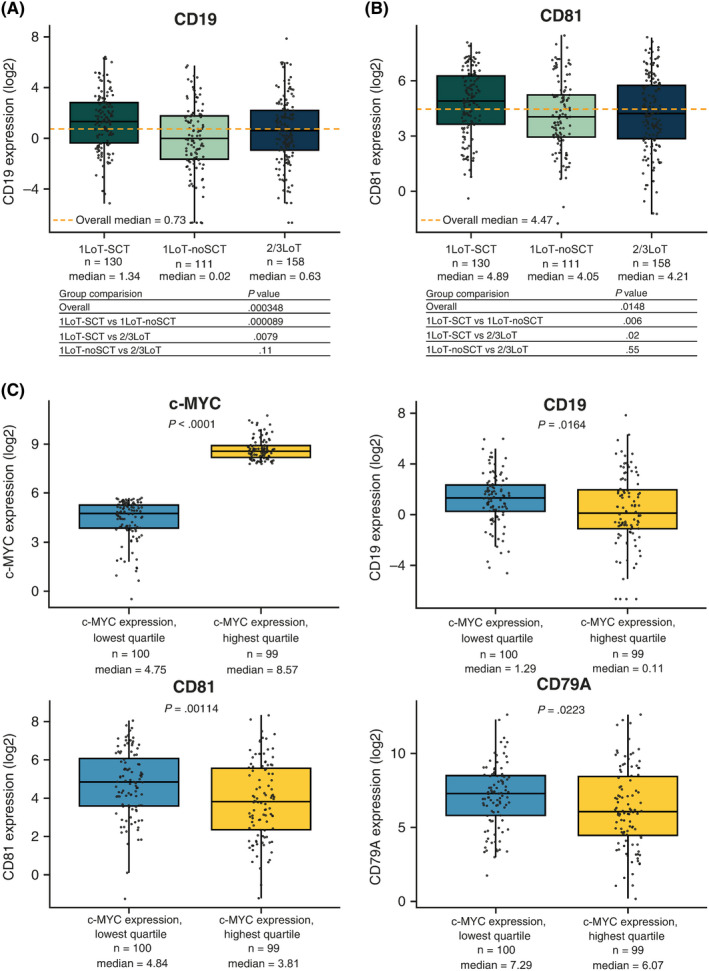
CD19 and CD81 expression by prior treatment exposure and by c‐MYC expression. Median levels of (A) CD19 and (B) CD81 were significantly higher in tumors from 1LoT‐SCT vs 1LoT‐noSCT or 2/3LoT patients. No difference was observed between 1LoT‐noSCT and 2/3LoT patients. C, CD19, CD81, and CD79A were highly expressed in tumors in the lowest quartile for c‐MYC expression. Solid black horizontal lines show the medians, dotted orange lines show the overall medians, boxes show interquartile range, lines show range excluding outliers. LoT, line of therapy; SCT, stem cell transplantation [Colour figure can be viewed at wileyonlinelibrary.com]