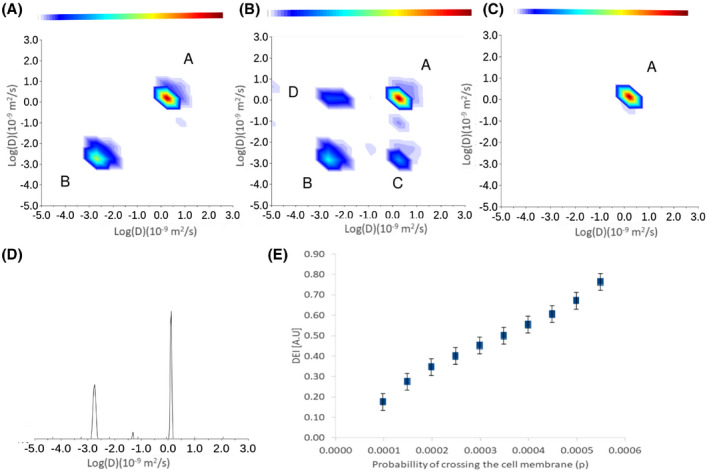
Figure 3.

Results of diffusion exchange simulations carried out in the yeast substrate. DEXSY diffusion‐diffusion exchange plots are shown for exchange probabilities of P = .0 (A), P = .0003 (B), and P = .1 (C). As in previous figures, labeled peaks correspond to extracellular diffusion (A), intracellular diffusion (B), extracellular to intracellular exchange (C), and intracellular to extracellular exchange (D). D, Results of DOSY simulations in the yeast substrate, with P = .0 (no exchange). E, DEI plotted against permeability
