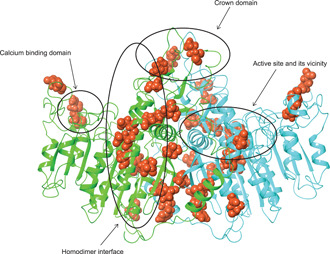
Figure 6.

Location of variants with DNE within the ribbon structure of the TNSALP dimer homology model. Positions where a dominant‐negative variant was found, are shown as red atoms. Mirror residues on the opposite chain are not marked with arrows/circles. DNE, dominant‐negative effect; TNSALP, tissue‐nonspecific alkaline phosphatase
