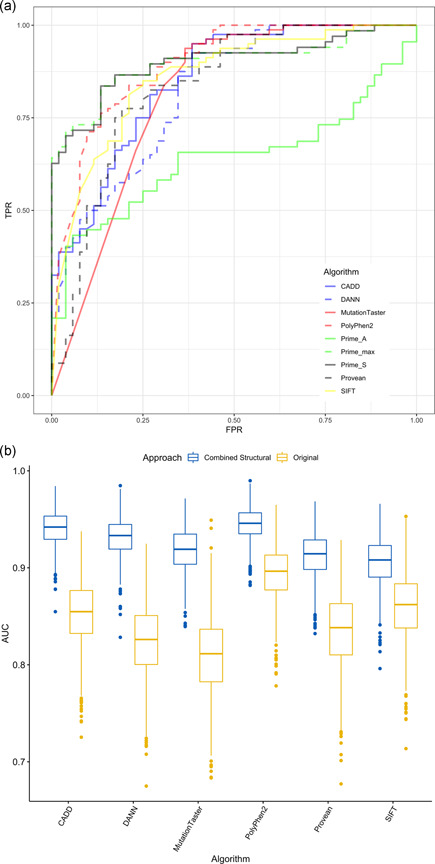
Figure 7.

ROC curves showing TPR versus FPR for variant prediction algorithms (a) and bootstrap AUCs for in silico algorithms by original AUC values and AUC and ROC values obtained after combining in silico scores with Δs (b). AUC, area under the ROC curve; CADD, Combined Annotation Dependent Depletion; DANN, Deleterious Annotation of Genetic Variants Using Neural Networks; FPR, false‐positive rate; PROVEAN, Protein Variation Effect Analyzer; ROC, receiver operating characteristics; SIFT, Sorting Intolerant From Tolerant; TPR, true‐positive rate; Δs, computationally predicted change in protein stability
