Figure 6.

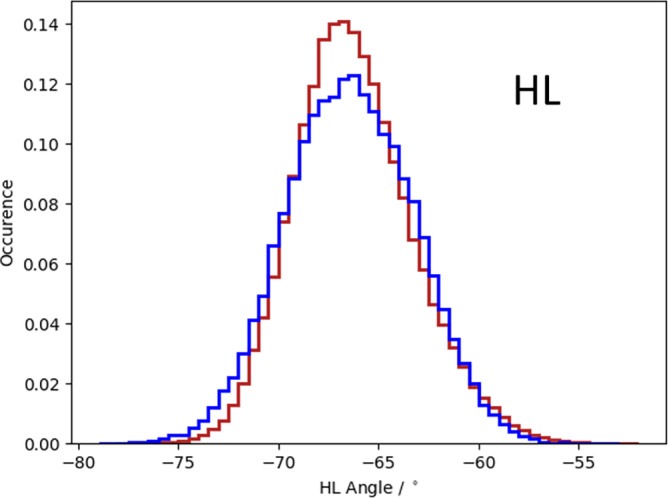
Overlay of the HL angle distributions of the complex (dark red) and the Fab (blue) simulated with NOE time‐averaged restraints. Fab, antigen‐binding fragment [Color figure can be viewed at wileyonlinelibrary.com]

Overlay of the HL angle distributions of the complex (dark red) and the Fab (blue) simulated with NOE time‐averaged restraints. Fab, antigen‐binding fragment [Color figure can be viewed at wileyonlinelibrary.com]