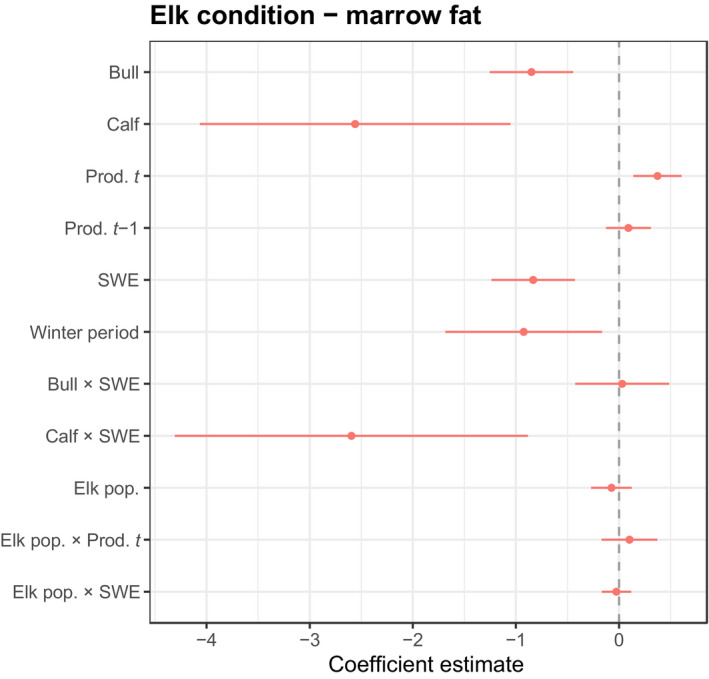
FIGURE 2.

Determinants of elk nutritional condition. Model‐averaged standardized coefficient values ± 95% CIs from a logistic regression fitting elk demographic, wolf pack size and climatic variables to data on marrow fat (1 = healthy marrow and 0 = depleted marrow). Results for bulls and calves are relative to cows which served as the base case
