
FIGURE 3.
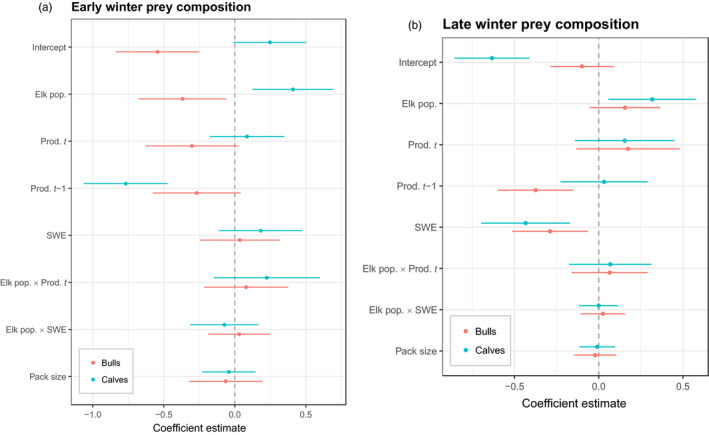
Wolf prey composition. Model‐averaged standardized coefficient values ± 95% CIs from a multinomial regression fitting elk population and climatic variables to data on elk demographic class (bull, cow and calf), with cow serving as the base case in (a) early winter and (b) late winter