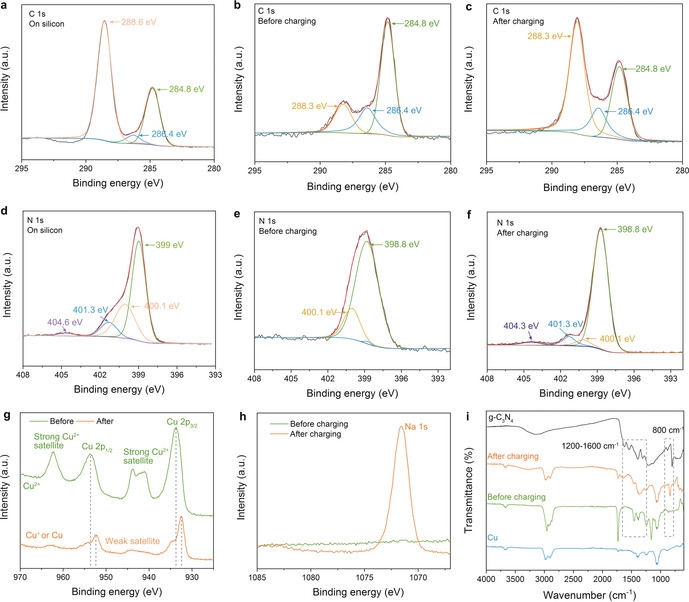
Figure 4.

a)–h) XPS analysis of g‐C3N4 on silicon and on copper before and after charging. a) C 1s on silicon, b) C 1s on copper (before charging), c) C 1s on copper (after charging), d) N 1s on silicon, e) N 1s on copper (before charging), f) N 1s on copper (after charging), g) Cu 2p on copper before and after charging, h) Na 1s on copper before and after charging. i) Infrared spectra of g‐C3N4 power, Cu foil and g‐C3N4 film on Cu foil before and after charging.
