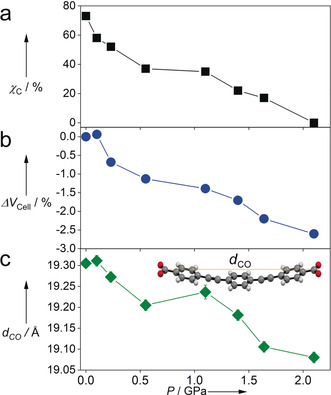
Figure 2.

The responses of a) the fractional population of the coplanar structure, χ C, obtained from occupancy refinement of the X‐ray data, b) unit cell volume, and c) peb2− length, d CO, to increasing pressure. Error bars are not shown in (a) and (b), as they are only marginally larger, or even smaller, than the size of the points.
