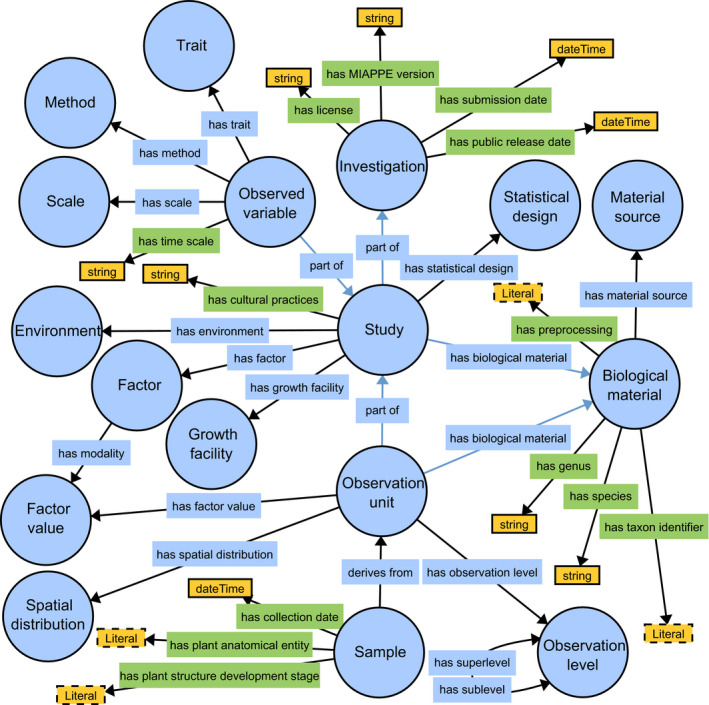
Fig. 1.

Subset of the Plant Phenotyping Experiment Ontology representing the MIAPPE data model. Generated using WebVOWL (http://editor.visualdataweb.org/) and edited manually. Circles indicate classes. Object properties are shown in blue rectangles, and data properties are shown in green rectangles. Yellow rectangles represent literals.
