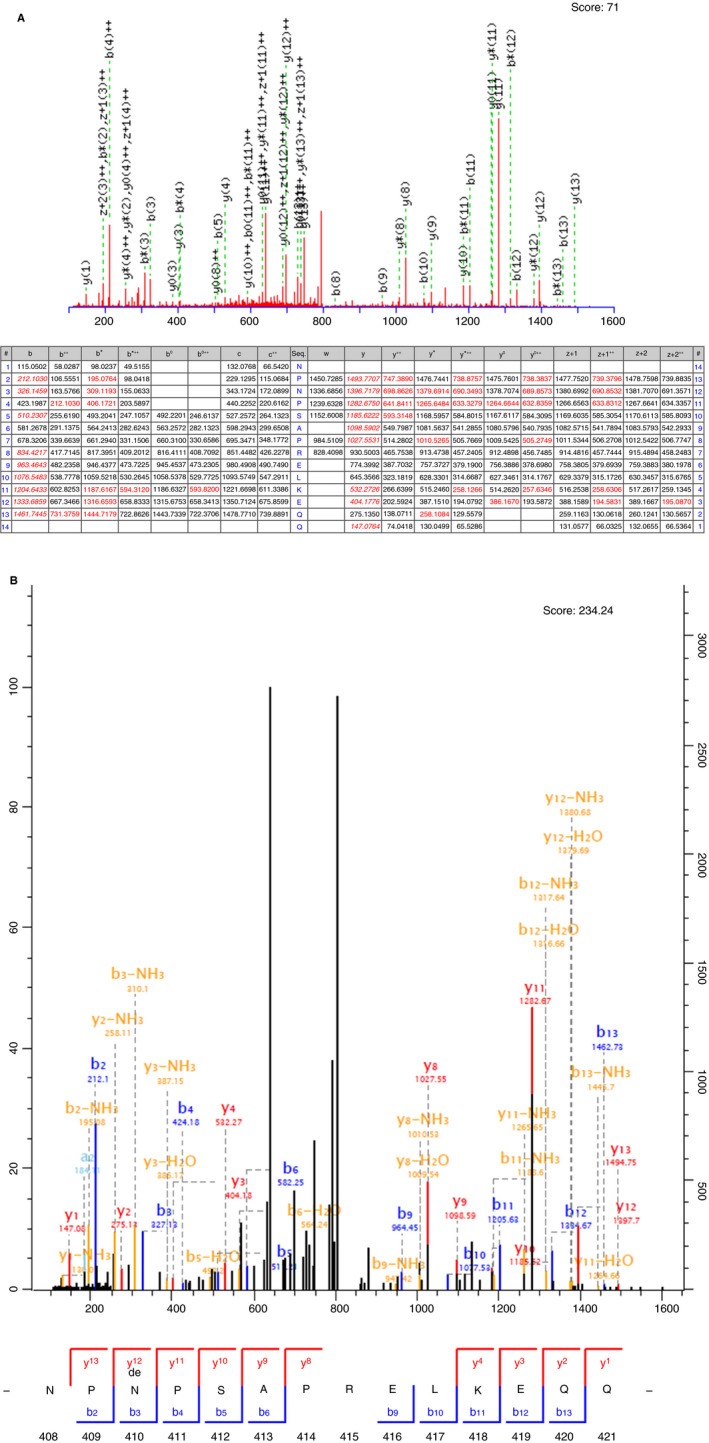
Figure 2.

MS/MS fragmentation spectra of the (A) nondeamidated and (B) deamidated Asn408‐Gln421 peptide in an overnight Arg‐C digest of NPB‐α2AP as determined by Mascot and MaxQuant analysis, respectively. Best spectrum data are shown. The overlapping labels of the peaks between m/z 730 and 750 in (A) should be read as the following: b(13)++ m/z 731.3759; y0(13)++,y*(13)++, z + 1(13)**, m/z 738.3837, 738.8757, 739.3796; y(13)++ m/z 747.3890
