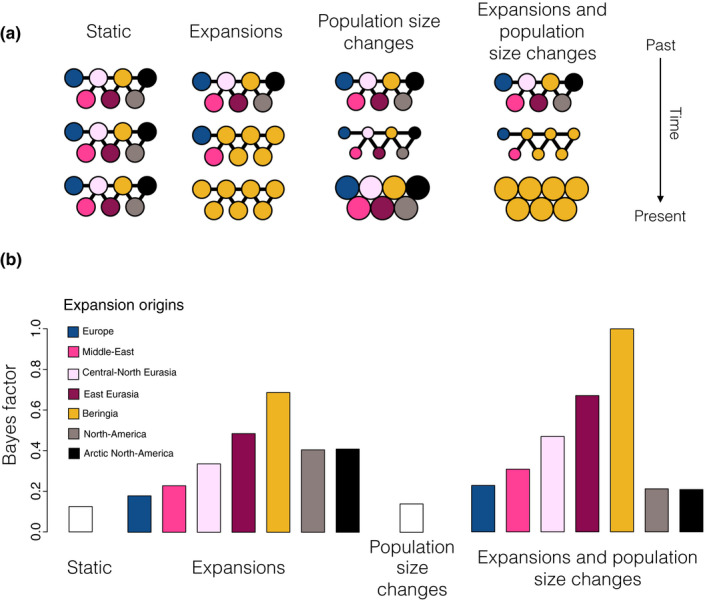
Figure 4.

Spatially and temporally explicit analysis. (a) Illustration of the different scenarios, with circles representing one deme each for the seven different geographical regions (see panel b for colour legend and text for full description of the scenarios). Solid lines represent population connectivity. The static scenario (far left) shows stable populations through time. The expansion scenario (middle left) shows how one deme (here yellow) expands and sequentially replaces the populations in all other demes (from top to bottom). The population size change scenario (middle right) illustrates how population size in the demes can change through time (large or small population size shown as large or small circles, respectively). We also show a combined scenario (far right) of both expansion and population size change. (b) Likelihood of each demographic scenario relative to the most likely scenario, shown as Bayes factors, estimated using Approximate Bayesian Computation analyses (see text for details). For expansion scenarios (including the combined expansion and population size changes), we colour code each bar according to the origin of the expansion (see colour legend)
