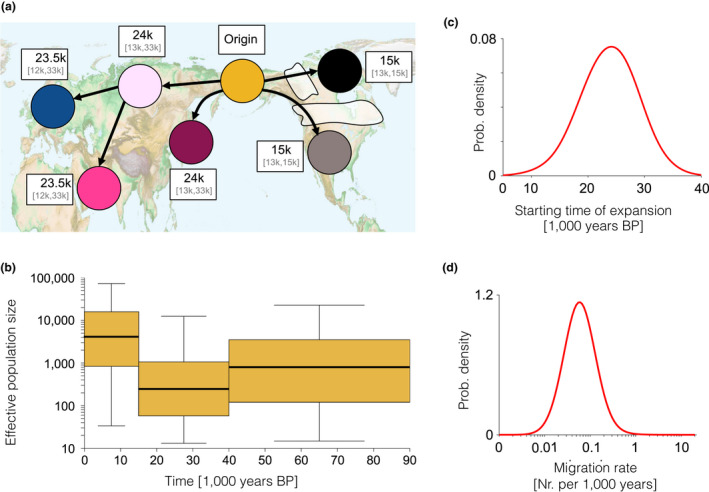
Figure 5.

The inferred scenario of wolf demography from the Bayesian analysis using our spatially and temporally explicit model (see Figure 4 and the main text). (a) Geographical representation of the expansion scenario (out of Beringia) with median and 95% confidence interval (CI) for the date of the population replacement in each deme given in white boxes next to each deme. (b) Effective population size (thick line, boxes and whiskers show the median, interquartile range and 95% CI, respectively, for each time period). (c) Posterior distribution of migration rate and (d) starting time of expansion [Colour figure can be viewed at wileyonlinelibrary.com]
