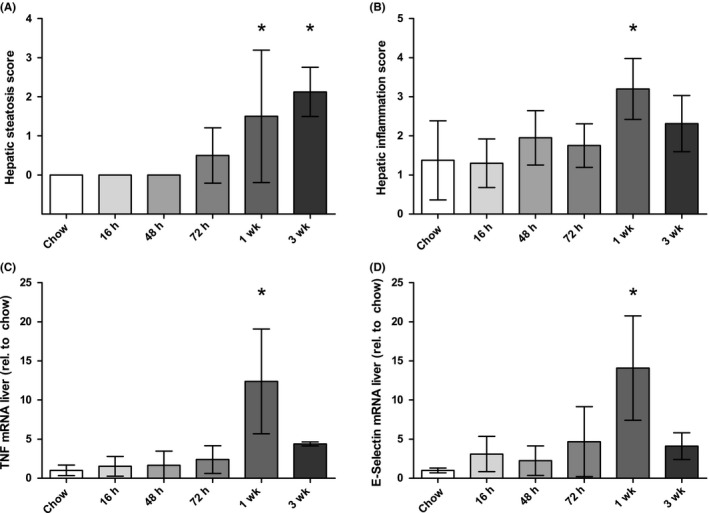
Figure 1.

Liver steatosis score (A), inflammation score (B), hepatic TNF mRNA expression (C) and hepatic E‐selectin mRNA expression (D) in LDLR−/− mice fed a Western‐type diet. Time points refer to time of sacrifice, see methods section. N = 5 mice per group. Data are expressed as mean ± SD, analysed with linear regression. *P < .05 versus chow
