FIGURE 1.

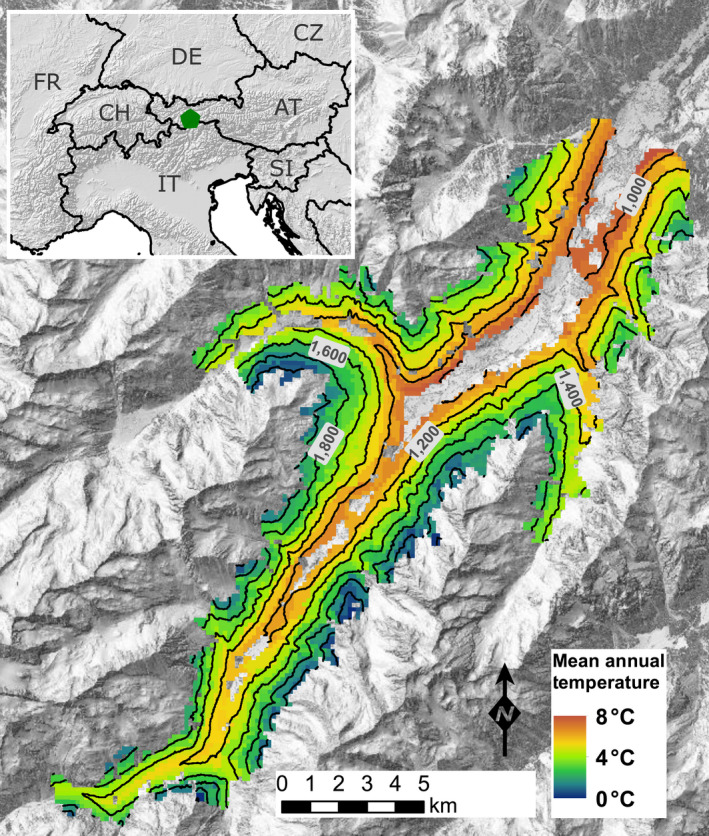
Map of the study area, showing the historical mean annual temperature (1961–2014) and the position of the landscape within Central Europe (insert). Isolines are 100 m apart (Basemaps from basemap.at, copernicus.eu, ec.europa.eu)

Map of the study area, showing the historical mean annual temperature (1961–2014) and the position of the landscape within Central Europe (insert). Isolines are 100 m apart (Basemaps from basemap.at, copernicus.eu, ec.europa.eu)