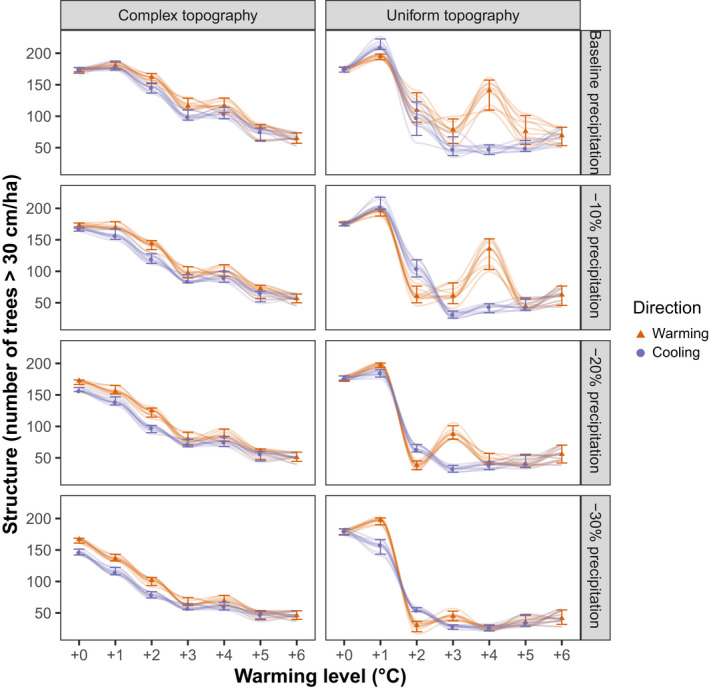
FIGURE 2.

The response of forest size structure (here described as the number of trees > 30 cm in diameter) to climate warming (red, triangles) and subsequent cooling (purple, circles). Values describe the state of the landscape at equilibrium (median, 5th and 95th percentiles across 10 replicates) and trajectories for all simulated replicates are shown. Trajectory lines are fitted using a LOESS model
