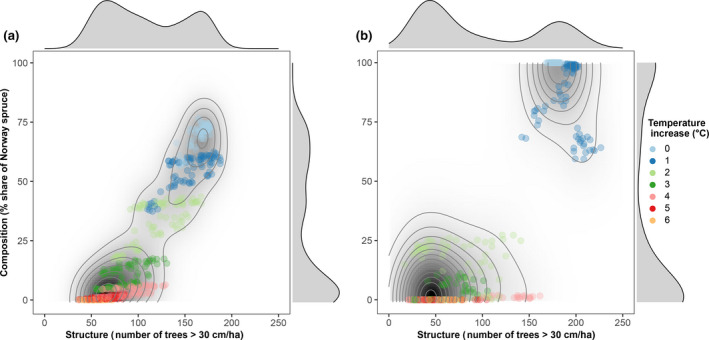
FIGURE 4.

Location of the forest landscape in structure–composition attractor space for different warming levels and the complex (a) and uniform (b) topography scenarios over all precipitation scenarios. Marginal plots and isolines give the probability density of all simulated cases, and indicate two alternative stable states for our study landscape
