Figure 1.

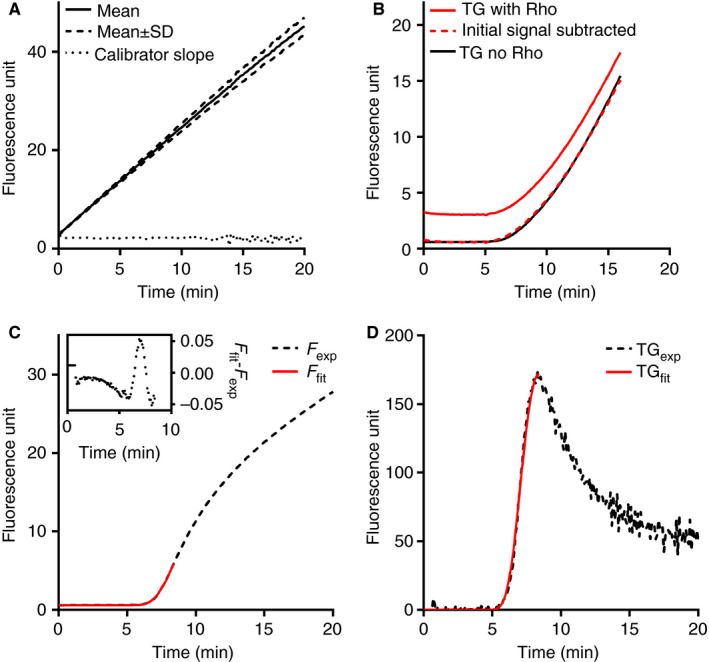
The performance of this novel WB‐TG assay and the CRG‐based calculation method. (A) The reaction between calibrator α2M‐T (100 nmol/L thrombin activity) and substrate P2Rho (300 μmol/L) in citrated whole blood. Mean (solid line) and mean ± standard deviation (dashed lines) of 12 replicate experiments are shown. The dotted line represents the first derivative of the average fluorescence tracing. (B) The fluorescence tracing of two parallel WB‐TG experiments at 2.5 pmol/L TF in the absence (black line) or presence (red line) of exogenously added 2.5 μmol/L Rhodamine (Rho) fluorophore. The red dashed line is the residual signal after subtracting the background Rho signal from the total signal. (C) An extended Chapman‐Richards growth (CRG) equation was fitted on the experimental fluorescence data from t = 0 until t = time‐to‐peak; the correctness of the fitting, as shown by the small difference between the fitted data (F fit, red solid line) and the experimental data (F exp, black dashed line) is shown in the insert. (D) The calculated thrombograms from the fitted data (TGfit, red solid line) and the experimental data (TGexp, black dashed line) overlap well with each other
