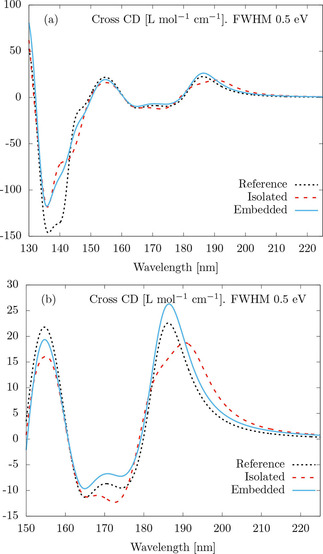
Figure 2.

Average CD of the cross in Figure 1 as a function of the wavelength. The “Reference” black dotted lines are obtained from TD‐HF computations on the cross. The dashed red lines and solid blue lines are T‐matrix‐based calculations. For the “Isolated” case, the quantum‐mechanical single molecule simulations are performed for a molecule in vacuum. For the “Embedded” case, the molecule in vacuum is embedded in the electrostatic potential created by the three other molecules forming the cross. In both cases, the linear response damping parameter corresponds to a Lorentzian line shape with full width at half maximum of 0.5 eV. Panels (a) and (b) show two different spectral ranges. The relatively large discrepancy around 142 nm seen in panel (a) does not appear in panel (b) for a better comparison of the accuracy of the “Embedded” and “Isolated” options.
