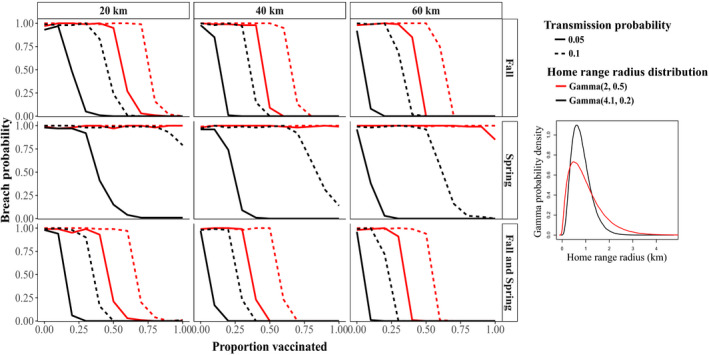
Figure 5.

Breach probability given different vaccination strategies and variable home range sizes. Columns correspond to vaccination zone widths (20, 40 or 60 km) and rows to vaccination timing (fall, spring or fall and spring). Line colour indicates the two home range radius gamma distributions (in km) which describe the variation in weekly home range size; black is data‐informed and red is hypothetical. Line type indicates between‐group transmission probabilities. Vaccination coverage is indicated along the x‐axes. Insert shows gamma probability density functions (with parametrization shape and scale) implemented as weekly varying home range radii
