
Figure 2.
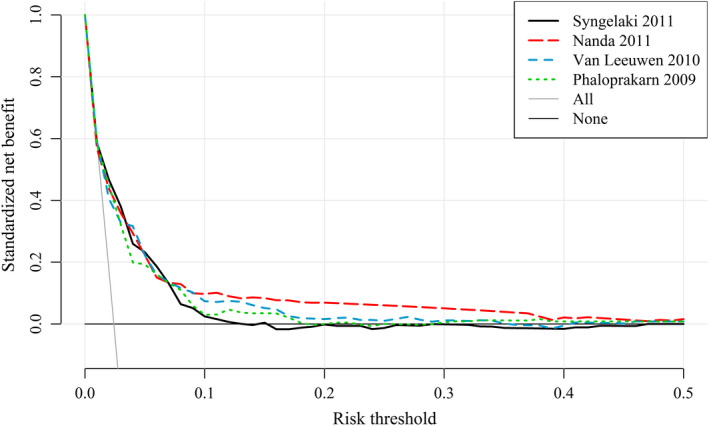
Decision curve analysis of four best performing models for the risk of gestational diabetes mellitus. The solid gray line is the net benefit when considering all women as at high risk and the horizontal black line when considering no women at high risk [Color figure can be viewed at wileyonlinelibrary.com]