
Figure 5.
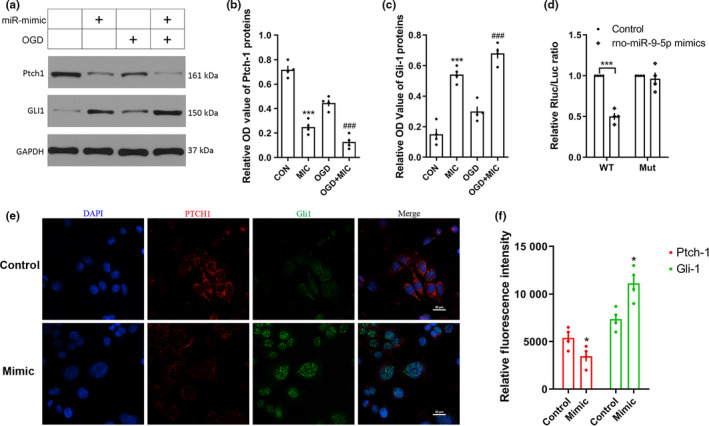
miRNA‐9‐5p targeted 3’UTR of ptch‐1and promoted the expression of Gli‐1. (a) The immunoblotting and quantitative data of (b) Ptch‐1 and (c) Gli‐1 acquired from BMECs. (d) The dual luciferase reporter assay. (e) The immunofluorescence and (f) quantitative data of Ptch‐1 and Gli‐1 in BMECs (Bar = 20 μm). (n = 4/group). (*p < .05, ***p < .001 vs. the untreated control group; ### p < .001 vs. the OGD group.) n: number of independent cell culture preparations in each group; CON: untreated control group; MIC: mimic; OGD: oxygen–glucose deprivation; WT: wild‐type; Mut: mutant type