
Figure 6.
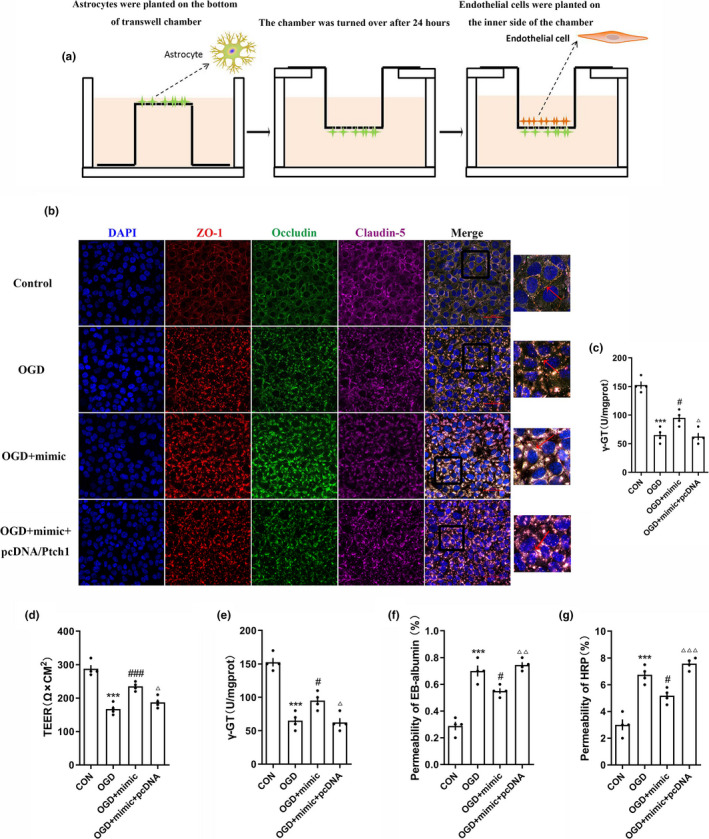
Over‐expression of miRNA‐9‐5p improved the stability of blood–brain barrier in vitro. (a) Reconstruction of the BBB model in vitro. (b) The immunofluorescence and (c) quantitative data of tight junction structure between BMECs (Bar = 50 μm). The quantitative data of miRNA‐9‐5p mimic on (d) TEER, (e) γ‐GT activity, (f) Evans blue, and (g) HRP permeability at 12 hr post‐injury induced by OGD (n = 4/group). ( ***p < .001 vs. the untreated control group; # p < .05, ### p < .001 vs. the OGD group.) n: number of independent cell culture preparations in each group; CON: untreated control group; BBB: blood–brain barrier; OGD: oxygen–glucose deprivation