
Figure 8.
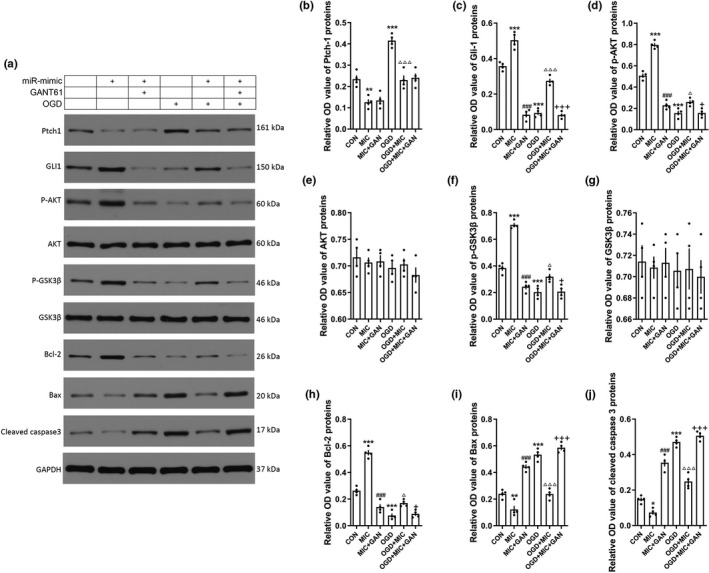
miRNA‐9‐5p mimic promoted AKT/GSK3β pathway by activating Hedgehog pathway. (a) The immunoblotting and quantitative data of (b) Ptch‐1, (c) Gli‐1, (d) p‐AKT, (e) AKT, (f) p‐GSK3β, (g) GSK3β, (h) Bcl‐2, (i) Bax, and (j) cleaved caspase 3 in BMECs treated with GANT61. (n = 4/group). (*p < .05, **p < .01, ***p < .001 vs. the untreated control group; ### p < .001 vs. the MIC group; △ p < .05,△△△ p < .001 vs. the OGD group; +p < .05,+++p < .001 vs. the OGD + MIC group.) n: number of independent cell culture preparations in each group; CON: untreated control group; OGD: oxygen–glucose deprivation; MIC: mimic; GAN: GANT61