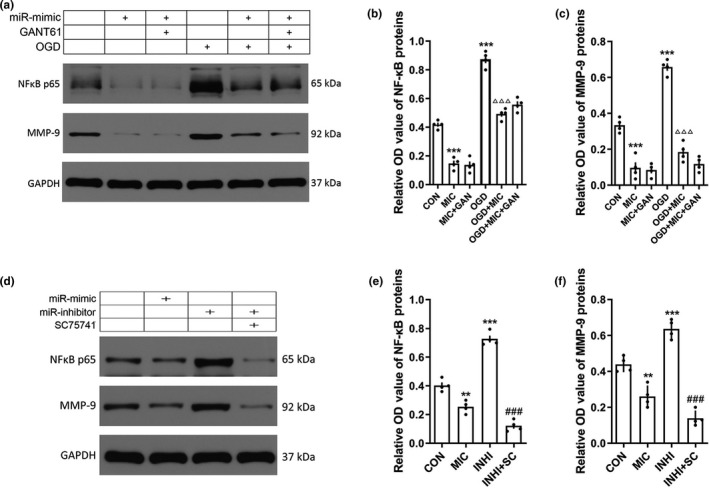
Figure 9.

miRNA‐9‐5p mimic inhibited NF‐κB/MMP‐9 pathway. (a) The immunoblotting and quantitative data of (b) NF‐κB and (C)MMP‐9 in BMECs treated with GANT61. (**p < .01, ***p < .001 vs. the untreated control group; ### p < .001 vs. the MIC group; △△△ p < .001 vs. the OGD group.) (d)The immunoblotting and quantitative data of (e) NF‐κB and (f) MMP‐9 in BMECs treated with QNZ. (n = 4/group) (**p < .01, ***p < .001 vs. the untreated control group; ###p < .001 vs. the INHI group.) n: number of independent cell culture preparations in each group; CON: untreated control group; OGD: oxygen–glucose deprivation; MIC: mimic; GAN: GANT61; INHI: inhibitor
