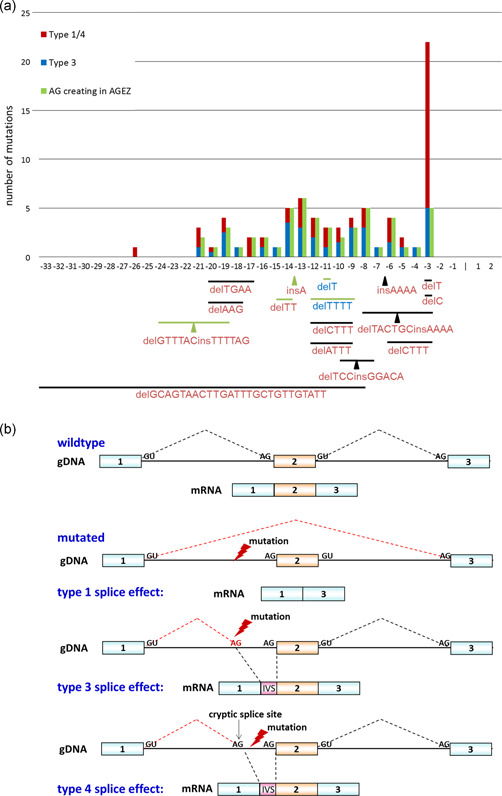
Figure 3.

(a) Schematic presentation of 91 NF1 3′ splice‐site mutations upstream of the canonical AG‐dinucleotide. Intronic positions ‐33 to ‐1 and the first two nucleotides (1 and 2) of the following exon are indicated on the x‐axis. The noncanonical single nucleotide substitutions are shown in the bar graph. The left bar shows the total number of substitutions per nucleotide position. Mutations that lead to skipping of the downstream exon (type 1) and/or usage of a cryptic 3ʹss (type 4) are displayed in red and mutations that create an AG‐dinucleotide which is used as a novel 3ʹss (type 3) are displayed in blue. The green bars to the right represent the number of these substitutions that generate an AG‐dinucleotide in the AG exclusion zone (AGEZ). Deletions (horizontal lines), delins (horizontal lines and arrowheads) and insertions (arrowheads) are indicated below the bar graph. Lines and arrowheads in green indicate that the mutation generates an AG‐dinucleotide in the AGEZ. The deleted and/or inserted nucleotides are given below the lines and arrowheads. Red letters indicate that the mutation leads to a type 1 or type 4 splice effect and blue letters indicate a type 3 splice effect. (b) Scheme illustrating the type 1, type 4, and type 3 splice effect of intronic 3'ss. Blue and orange boxes indicate exons and the intervening lines intronic sequences of a gene. Wildtype and mutated genomic DNA (gDNA) sequences are shown and the dotted lines indicate which sequences are spliced out to generate the mRNA transcripts as shown below the schematic representation of the gDNA sequences
