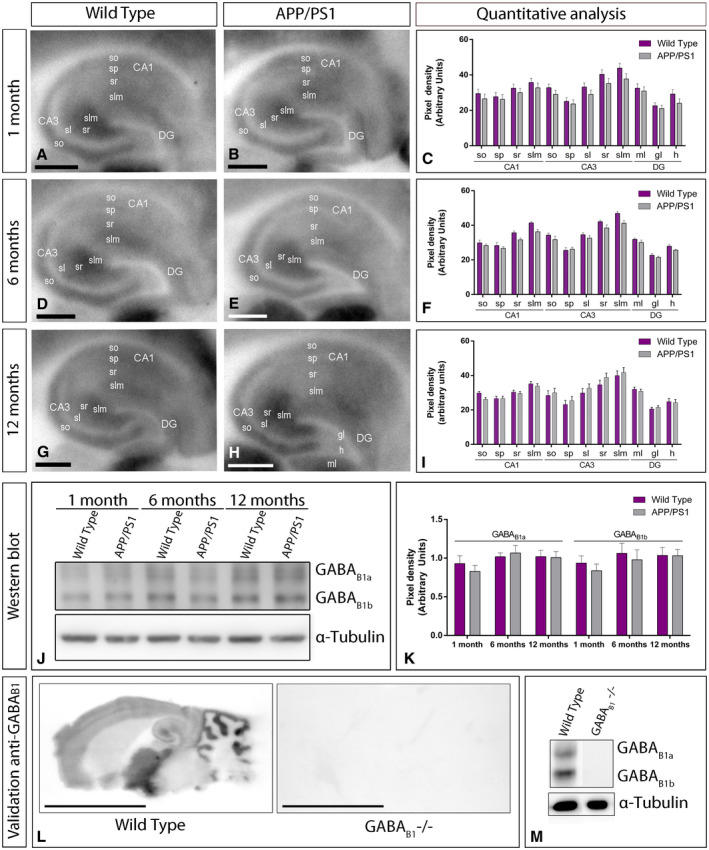
Figure 2.

Hippocampal expression and distribution of GABAB1 in wild‐type and APP/PS1 mice. A‐I. The expression of the GABAB1 protein was visualized in histoblots of horizontal brain sections at 1, 6 and 12 months of age in wild‐type and APP/PS1 mice using an affinity‐purified anti‐GABAB1 antibody. GABAB1 expression in different hippocampal subfields and dendritic layers was determined by densitometric analysis of the scanned histoblots. GABAB1 expression was moderate to strong in all dendritic layers of the CA1 and CA3 region and dentate gyrus, with the stratum lacunosum‐moleculare (slm) of CA3 showing the highest expression level. Densitometric analysis showed no differences in GABAB1 expression in APP/PS1 mice compared to age‐matched wild type controls. J,K. Western blots showing the expression of the GABAB1 protein in the hippocampus at 1, 6 and 12 months of age in wild‐type and APP/PS1 mice. Crude membrane preparations were subjected to 7.5% SDS‐PAGE, transferred on to polyvinylidene difluoride membranes. They were reacted with an anti‐pan GABAB1 antibody, which recognised both GABAB1a and GABAB1b subunits with estimated molecular masses of 130 and 100 kDa, respectively. The developed immunoblots were scanned and densitometric measurements from five independent experiments were averaged together to compare the protein densities for each age and experimental group. Quantification of GABAB1a and GABAB1b normalised to α‐tubulin and expressed as pixel density showed no differences in APP/PS1 mice compared to age‐matched wild type controls. Error bars indicate SEM. L,M. Characterization of the monoclonal anti‐GABAB1 in the mouse brain. The pattern of GABAB1 expression observed in the wild type using histoblot disappeared completely in the brain of GABAB1 null mice (GABAB1‐/‐). Using western blots, immunolabeling signal was abolished in the GABAB1‐/‐ mice, while strong bands for GABAB1a and GABAB1b subunits were present in the wild type. Scale bars: A,B,D,E,G,H, 0.05 cm; L, 0.5 cm. [Correction added on 6 March 2020, after first online publication: The western blot image in Figure 2 has been amended to a version without splicing.]
