
Figure 3.
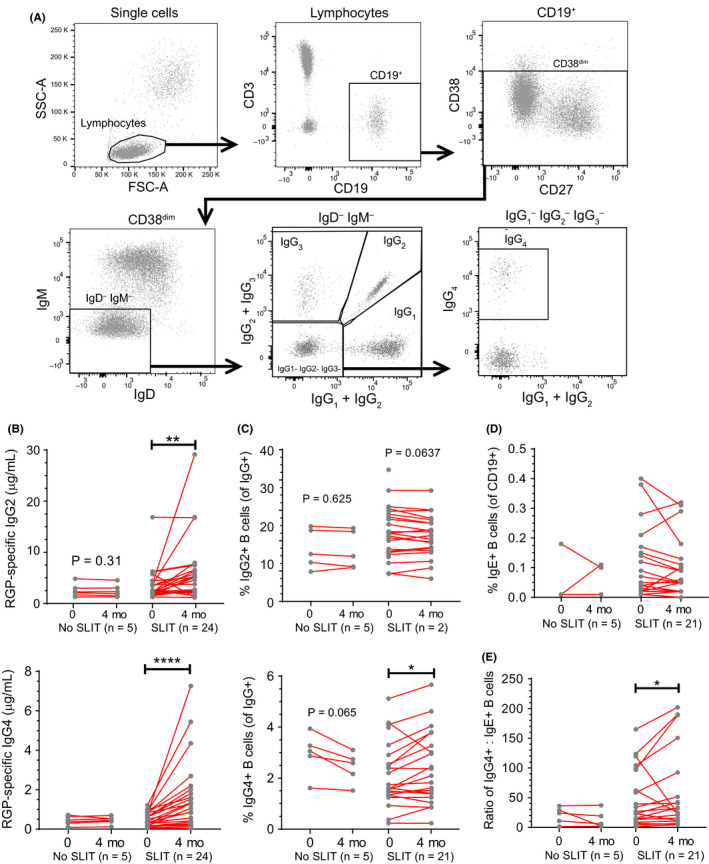
RGP‐specific IgG4 and IgG4 +:IgE+ memory B‐cell ratio increased after a 4‐mo course of SLIT. A, Gating strategy for Ig isotype and IgG subclass‐expressing memory B cells by flow cytometry. B, RGP‐specific IgG2 and IgG4 in sera and C, proportion of IgG2 + and IgG4 + memory B cells as a percentage of IgG+ population after 4 mo of SLIT. D, Proportion of IgE+ memory B cells as a percentage of total CD19+ B cells after 4 mo of SLIT. E, Ratio of IgG4 + to IgE+ B‐cell percentages after 4 mo of SLIT (from C and D). Each dot represents one individual; red lines indicate median values. Statistical analysis was performed between baseline and each follow‐up time point to assess changes induced by SLIT using the Wilcoxon signed‐rank test. *P < .05 and ****P < .0001