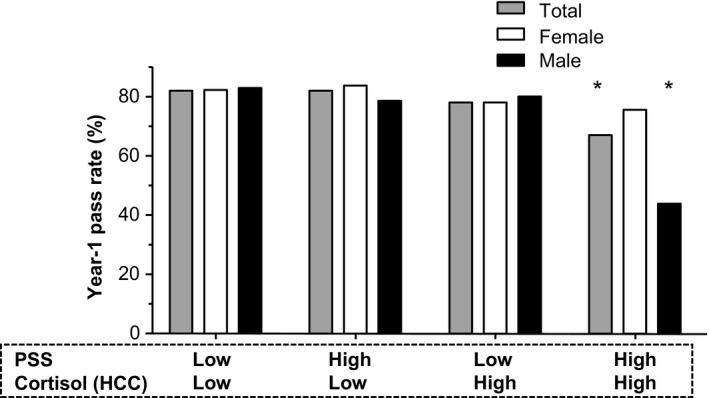
Figure 2.

Year‐1 performance and compound Perceived Stress Scale (PSS) scores and hair cortisol concentration (HCC) values. Year‐1 pass rates for all participants combined (n = 268) and by gender (ie, female [n = 178] and male [n = 90]) divided according to compound score based on median values for PSS (26.00) and HCC (25.30). Reference group: LowLow (≤ median for both PSS score and HCC value). *P < .05
