Figure 1.

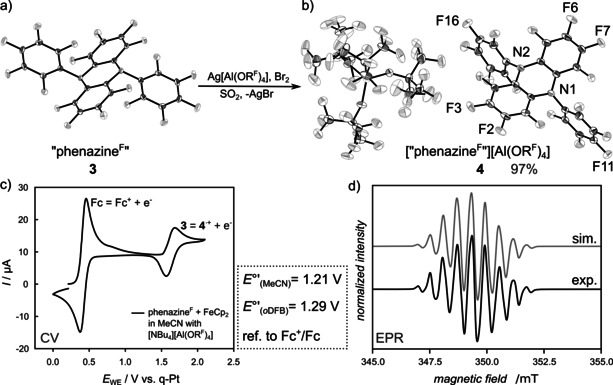
a) Molecular structure of “phenazineF” (3) and b) molecular structure of [“phenazineF”][Al(ORF)4] (4). Data collected at 100 K. Co‐crystallized CH2Cl2 omitted for clarity. Thermal displacement ellipsoids set at 50 % probability.28 c) Cyclic voltammogram of 3 (10 mm) in MeCN with Fc+/Fc as internal reference and [NBu4][Al(ORF)4] (100 mm) as conducting salt. The half‐wave potential is independent of the sweep rate. d) X‐band continuous‐wave‐EPR spectrum of 4 in SO2 at ambient temperature (black). The spectrum was recorded at a microwave frequency of 9.7973 GHz on an Elexsys E580 (Bruker Biospin) spectrometer equipped with a 4119HS‐W1 (Bruker) cavity using a microwave power of 0.04743 mW (35 dB attenuation, 200 mW source power), a modulation frequency of 100 kHz and a modulation amplitude of 0.05 mT. The corresponding spectral simulation is shown in gray. Two sets of six and two equivalent fluorine atoms with isotropic hyperfine coupling constants were used for the simulation. The isotropic hyperfine constants were determined as 15.44 and 20.35 MHz, respectively. The Gaussian linewidth was determined to be 0.267 mT (full width at half maximum).
