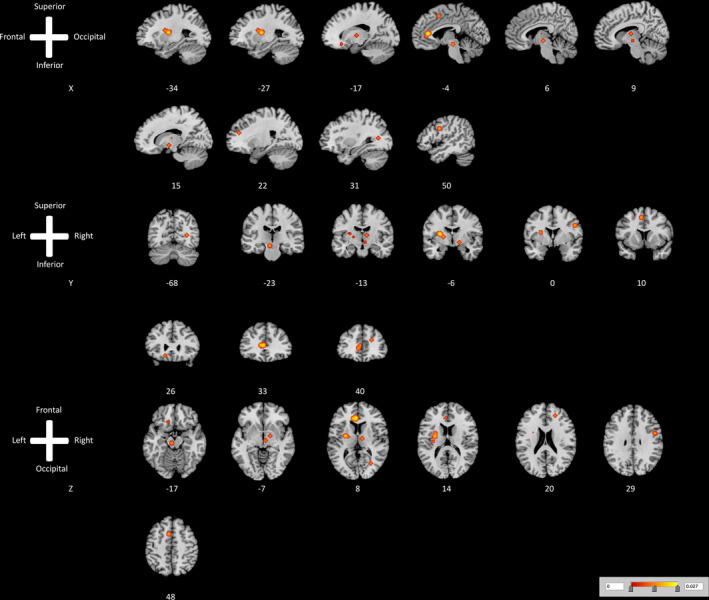
Figure 2.

ALE map investigating increased cerebral blood flow as measured by H2 15O‐PET caused by ON vs. OFF invasive motor cortex stimulation. This image summarizes the results of all the papers involved in this meta‐analysis on changes in cerebral blood flow induced by active invasive motor cortex stimulation. Red color shows gray matter decreases (ALE maps were computed at a threshold of p < 0.001). [Color figure can be viewed at wileyonlinelibrary.com]
