
Figure 3.
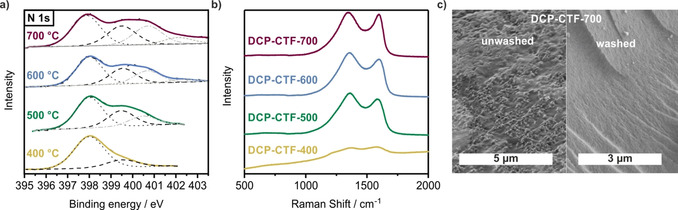
a) Deconvoluted N 1s XPS spectra that show pyridinic (BE≈398.0 eV), pyrrolic (BE≈399.5 eV), quaternary (BE ≈400.7 eV), and oxidized N species (BE≈402.3 eV). b) Raman spectra of DCP‐CTF samples that reveal a different degree of carbonization. c) SEM pictures of DCP‐CTF‐700 that compare an unwashed and washed sample.