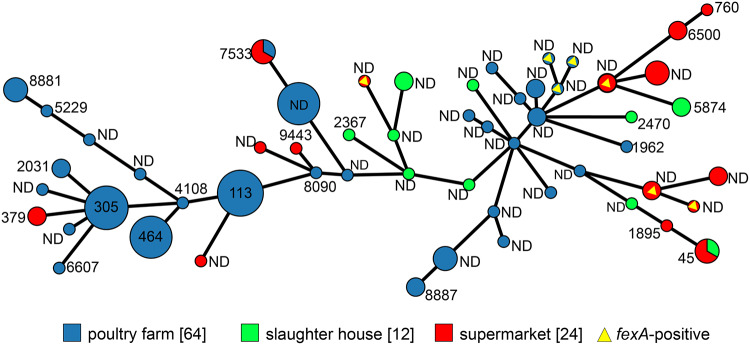
FIG 3.
Minimum spanning tree of fexA-positive and fexA-negative C. jejuni isolates according to MLST and gene allele profile. The tree was created by BioNumerics (Applied Maths, Belgium). Each node within the tree represents a single ST. The size of the nodes is proportional to the number of isolates represented by said node. Selected nodes are labeled with corresponding ST, phylogenetic group, and number of represented isolates. ND, unknown ST.

