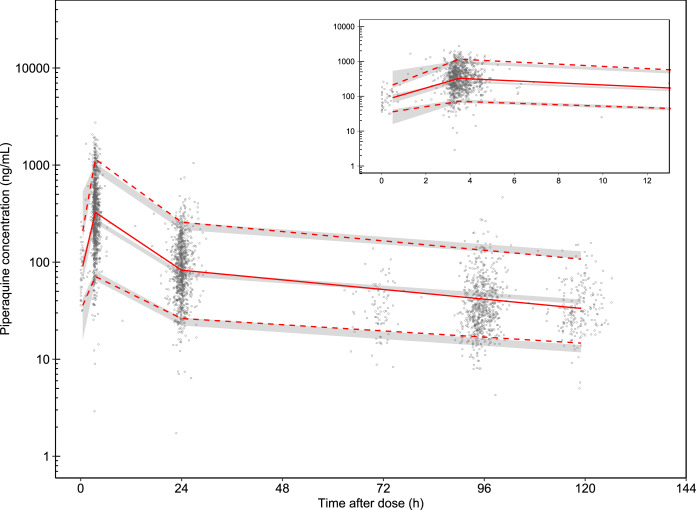
FIG 1.
Visual predictive check of the final piperaquine pharmacokinetic model. The open circles represent the observed piperaquine concentrations. Solid red lines represent the 50th percentiles of the observations, and dashed red lines represent the 5th and 95th percentiles of the observations. The shaded areas represent the 95% confidence intervals of each simulated percentile (n = 2,000).

