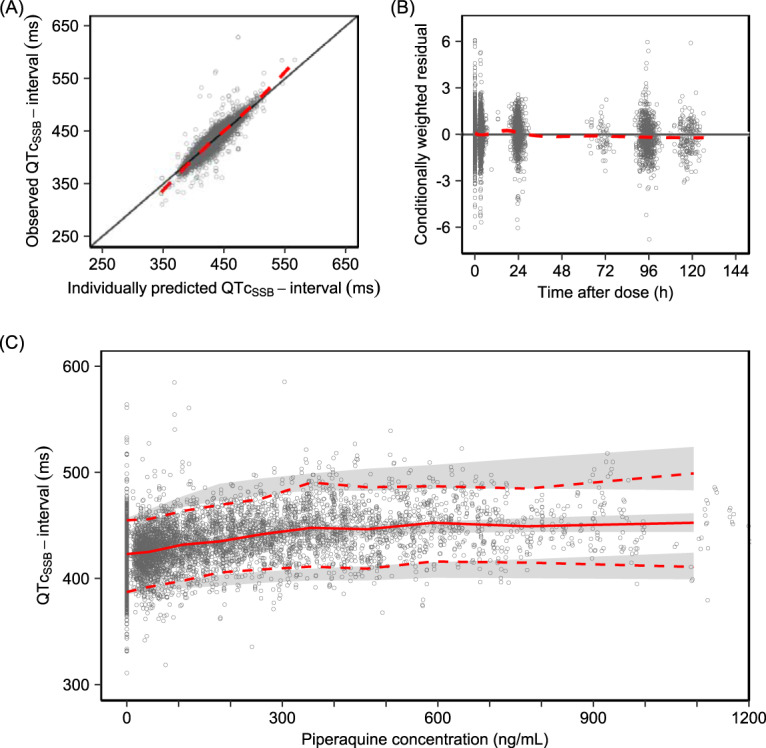
FIG 3.

Diagnostics of the final pharmacokinetic-pharmacodynamic model. (A and B) Goodness-of-fit plots showing observed QTcSSB interval versus individually predicted QTcSSB interval (A) and conditionally weighted residual versus time after dose (B). The solid black lines represent the line of identity, and the dashed red lines represent a local polynomial regression fitting of all observations (i.e., trend line). (C) Visual predictive check of the model describing the relationship between piperaquine concentrations and absolute QTcSSB intervals using an Emax function (n = 2,000). The open circles represent the observations. The solid red line represents the 50th percentile of the observations, and dashed red lines represent the 5th and 95th percentiles of the observations. The shaded areas represent the 95% confidence intervals of each simulated percentile.
