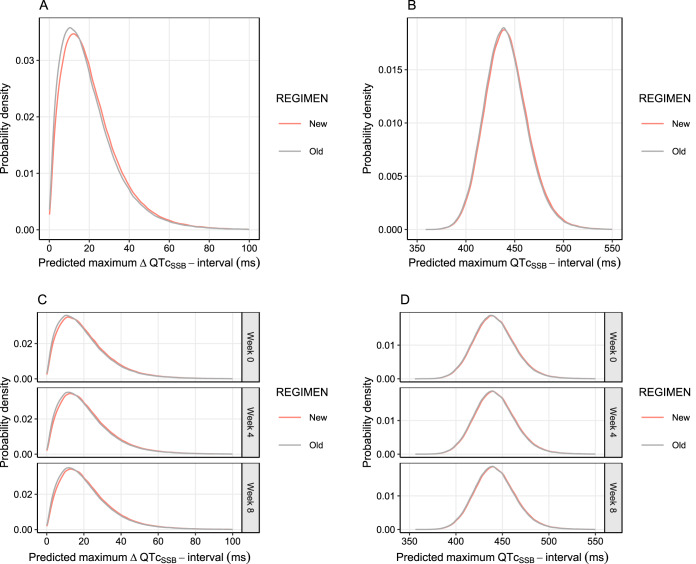
FIG 5.
Probability density of maximum QTcSSB intervals and ΔQTcSSB intervals after different dosing regimens, simulated from the final pharmacokinetic-pharmacodynamic model. The graphs shows the probability density distribution of maximum QTcSSB intervals and maximum ΔQTcSSB intervals based on a total of 480,000 simulated patients after receiving the old (gray solid lines) and new (red solid lines) dosing regimens for acute malaria treatment (3-day regimen) (A and B) and for mass drug administration (monthly 3-day regimen) (C and D).

