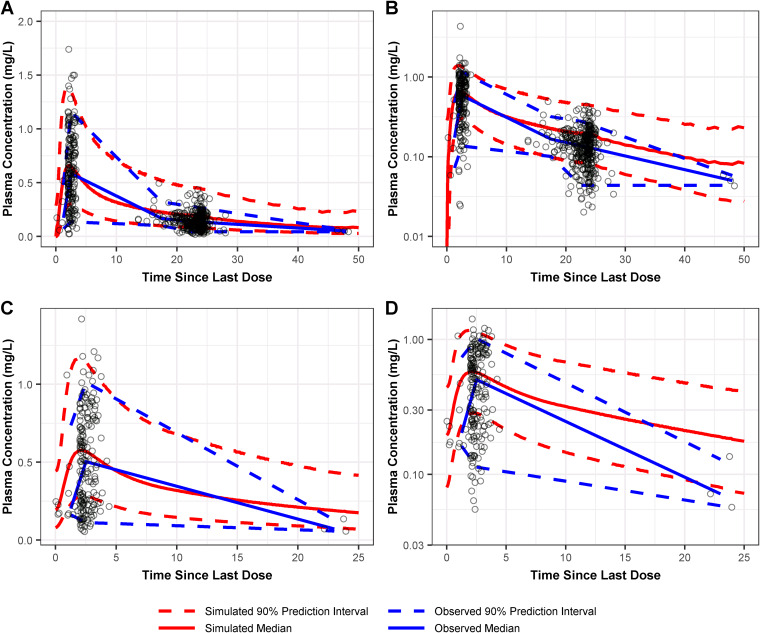
FIG 3.
Prediction-corrected visual predictive check of observed and simulated omadacycline plasma concentrations on linear and log scales following administration of 450 mg omadacycline p.o. q24h (A and B, respectively) and 300 mg p.o. q24h (C and D, respectively) from the external validation data set for the final population PK model.

