Figure 59.

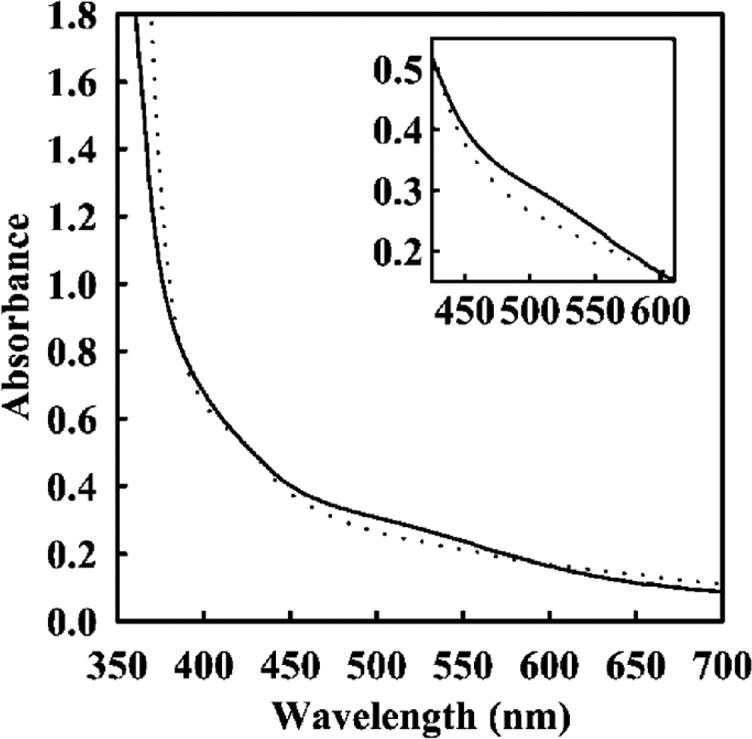
UV–vis spectra of purified ΔnifB (solid line) and ΔnifH (dotted line) MoFe. Samples concentrations were 10 mg/mL. Reproduced with permission from ref (551). Copyright 2002 American Society for Biochemistry and Molecular Biology.

UV–vis spectra of purified ΔnifB (solid line) and ΔnifH (dotted line) MoFe. Samples concentrations were 10 mg/mL. Reproduced with permission from ref (551). Copyright 2002 American Society for Biochemistry and Molecular Biology.