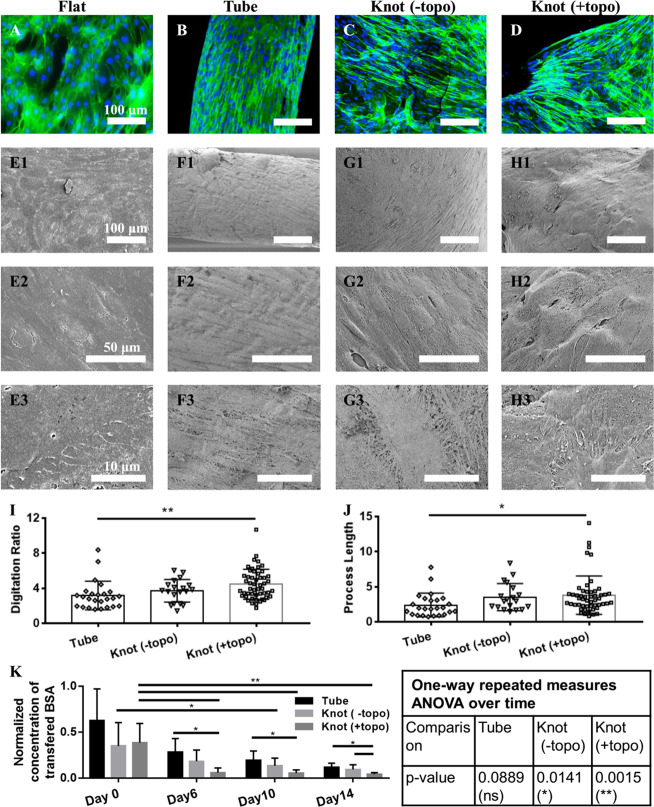
Figure 5.
The topographical microenvironment guides podocytes’ morphology and function. Merged images of F-actin and DAPI nuclear staining (A–D) and SEM images showing the cell morphology (E–H) of podocytes, cultured on the flat PDMS (Flat), hydrogel tube (Tube), hydrogel knot without microconvex topography (Knot (-topo)), and hydrogel knot with microconvex topography (Knot (+topo)), respectively. Quantification of digitation ratio (I) and process length of podocytes (J). Digitation ratio is defined as the digitated length over the boundary length. The process length (μm) is the average length of the measured processes. The quantification method is described in Figure S7. Data were analyzed by one-way ANOVA. (K) The concentration of transferred albumin in the middle well for the hydrogel tube (Tube), hydrogel tube with knot (Knot (-topo)), and hydrogel tube with knot and microconvex topography (Knot (+topo)) with cells being differentiated for 0, 6, 10, and 14 days was tested. The concentration was normalized to the concentration of transferred albumin measured for the cell-free scaffold on day 0. The normalized concentrations of each group were analyzed by one-way repeated measures ANOVA over time. The normalized concentrations of the three groups on Day 0, Day 6, Day 10, and Day 14 were analyzed by one-way ANOVA. Data are shown as average ± s.d., * p < 0.05, ** p < 0.01.

