Figure 4.

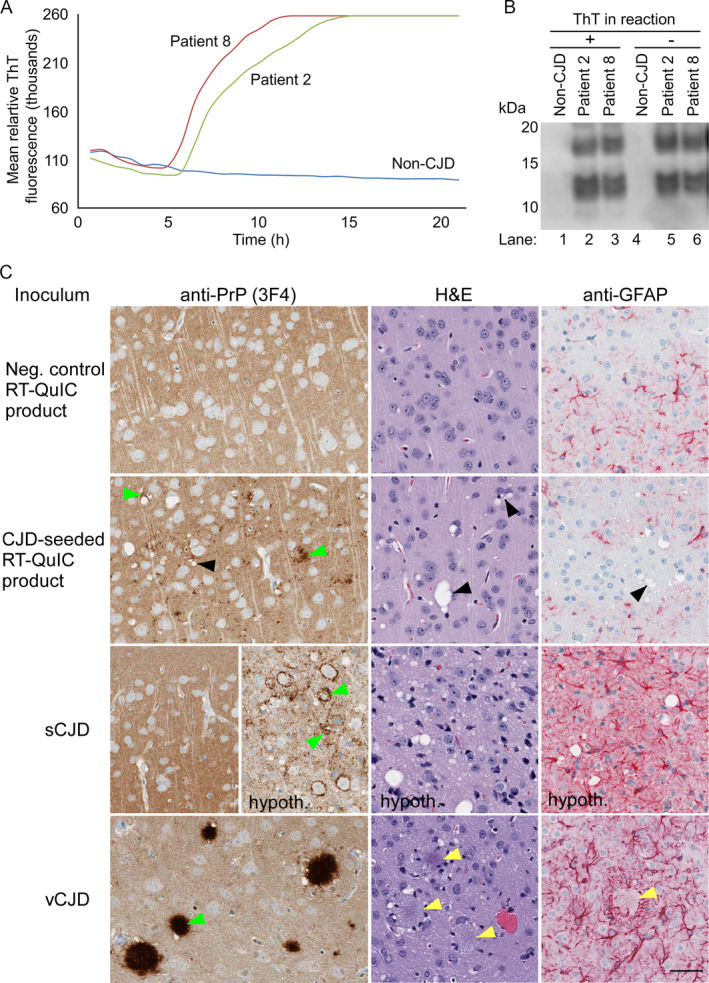
Analyses of RT‐QuIC products that were inoculated (A, B) and the resultant neuropathology (C). A. RT‐QuIC amplification of prion seeding activity in quadruplicate reactions seeded with 10‐3 dilutions of brain tissue from Patients 2 and 8, and a non‐CJD patient. The y axis indicates the average thioflavin T fluorescence of four replicate wells. B, Immunoblotting of proteinase K‐digested RT‐QuIC conversion products generated at the same time as the reactions in A. Lanes 1–3 are conversion products containing ThT while lanes 4–6 are products generated in the absence of ThT. C, Histological analyses of brain from Tg66 mice inoculated with RT‐QuIC reaction products seeded with BH from either a negative control patient without CJD (at 560 dpi; top row) or an MM1 sCJD Patient 8 (at 565 dpi; second row). For comparison, corresponding tissues from Tg66 mice inoculated with sCJD (180 dpi; third row) or variant CJD MM1 (vCJD; at 396 dpi; bottom row) are shown. All panels show sections of cerebral cortex, except for those labeled “hypoth” which are from the hypothalamus. The latter are shown because the hypothalamus was the most affected brain area while cerebral cortex was relatively spared, as is typical of sCJD‐inoculated Tg66 mice. The antibody or stain used for each column is shown on top. Green arrowheads show examples of abnormal PrP deposition. Black arrowheads show examples of vacuoles present in brain of mice inoculated with sCJD‐seeded RT‐QuIC product. Scale bar = 50 µm and applies to all panels
