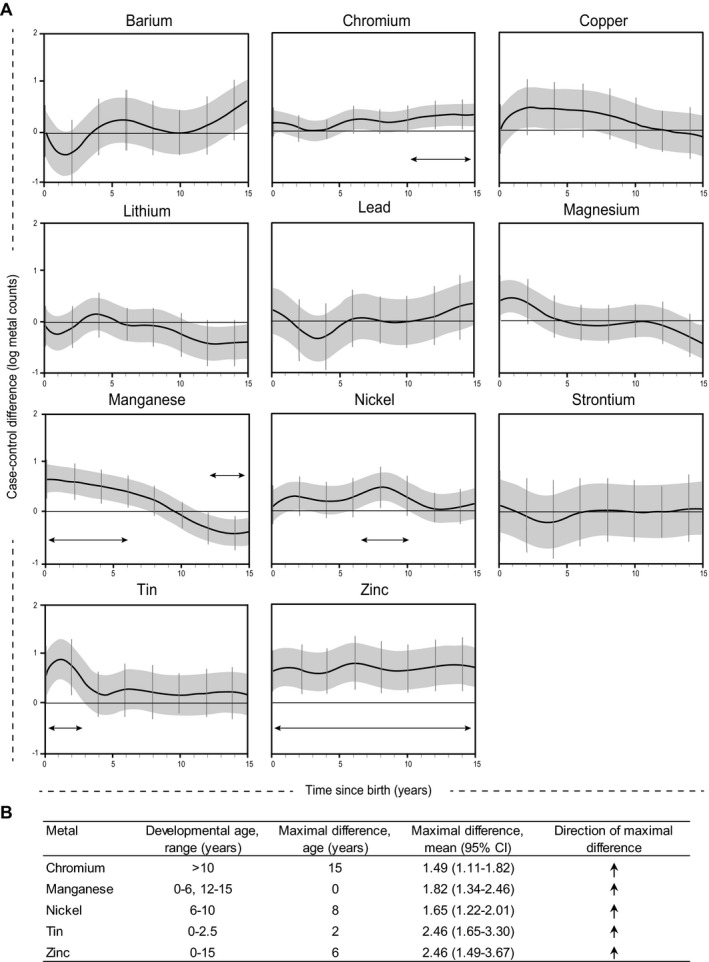
Figure 1.

Early life developmental differences in metal uptake between ALS cases and controls. (A) Graphical representation of reverse DLMs. Results were adjusted for batch, sex, age at tooth extraction, smoking history, and intra‐subject correlated observations. Significant windows of exposure are defined as periods where the 95% piecewise CIs (grey bands) and the 95% Holm–Bonferroni family‐wise CIs (vertical bars) do not cross zero. ALS cases, n=36; controls, n=31. The developmental stages of maximal difference are indicated by arrows. (B) Critical windows of divergence for individual metals between cases and controls observed in (A).
