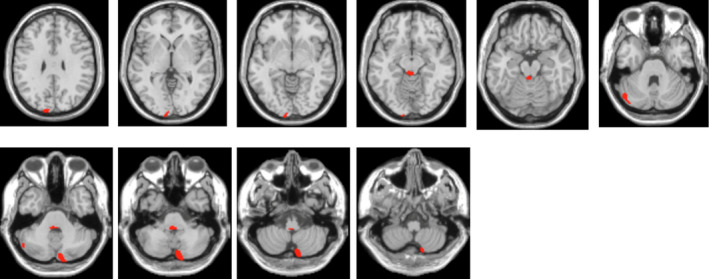
Figure 2.

Regions displaying hypometabolism in patient 1 compared with controls. 18F‐FDG‐PET analysis revealed hypometabolism of the left cuneus and lingual gyrus, right inferior semilunar lobule of the cerebellum, left cerebellar tonsil, and culmen of the cerebellum.
