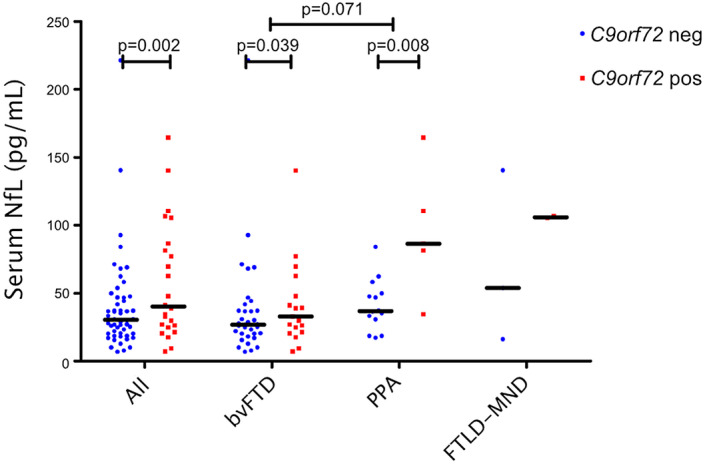
Figure 1.

SNfL concentrations of FTLD patients displaying different clinical phenotypes and grouped according to the C9orf72 repeat expansion genetic status. Blue dots represent repeat expansion non‐carriers (C9orf72 neg) and red squares carriers (C9orf72 pos). Black horizontal lines indicate a group median. The P values displayed stem from the linear regression model with sNfL log‐transformed and age as a covariate. Statistical testing among the FTLD‐MND group and other groups was not done due to insufficient sample size.
