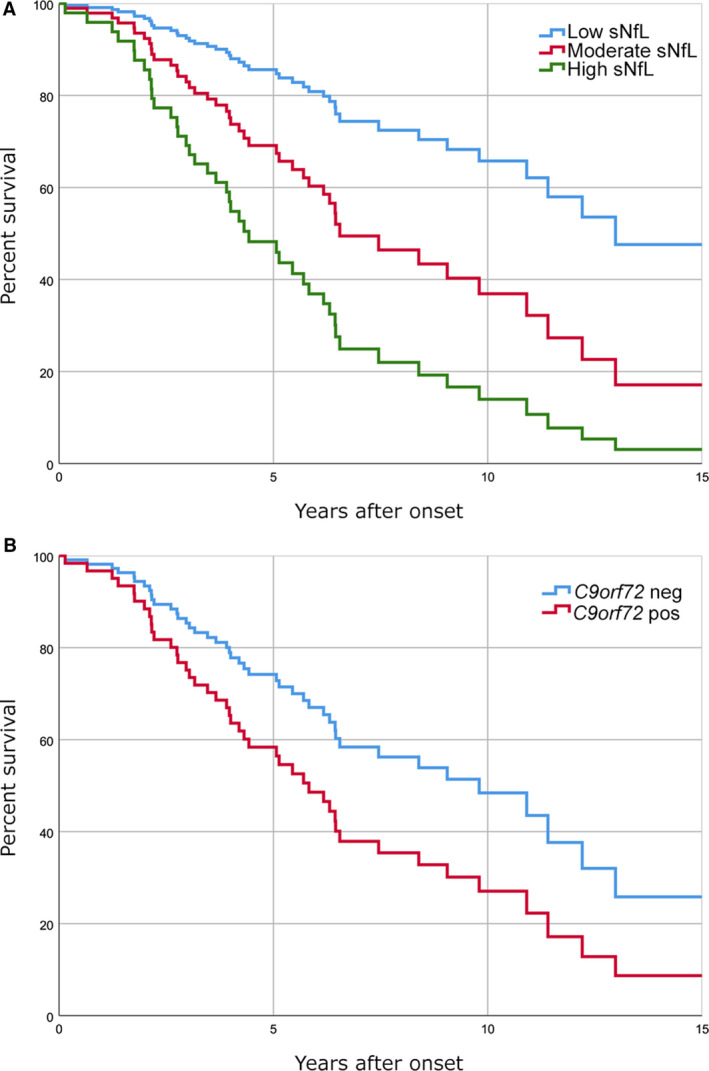
Figure 2.

Survival rates after the onset of the disease in FTLD patients according to sNfL levels and C9orf72 genetic status. (A) Graph showing that the group with higher sNfL levels had a lower survival rate than those with low or moderate sNfL levels. The groups were formulated by dividing the whole FTLD cohort into three equally sized (n = 26) groups according to their sNfL levels (low < 26.1 pg/mL, moderate 26.1–44.4 pg/mL, and high> 44.4 pg/mL). Differences in survival among groups were statistically significant (P < 0.001) (B) Graph showing survival rates of the C9orf72 repeat expansion carriers (n = 26) and non‐carriers (n = 52). The difference in survival rate showed a trend of shorter survival of C9orf72 carriers compared to non‐carriers; however, the difference was not statistically significant (P = 0.080).
